

RTN-045
Guidelines for User Tutorials#
Abstract
This document defines the guidelines, principles, and formats for user-facing tutorials that demonstrate how to use the Rubin Science Platform (RSP) to analyze data from the Legacy Survey of Space and Time (LSST). All Rubin staff and the broader science community should use these guidelines when contributing to the sets of Jupyter Notebook or documentation-based tutorials maintained by the Rubin Community Science team (CST).
Principles#
All tutorials should adhere to the following principles and to the Rubin Developers Guide.
Inclusive. Follow the best practices described under Accessibility considerations. Offensive or exclusionary language is never permitted (e.g., violent or ableist terms). See the Rubin Observatory Communications Code of Conduct for additional guidance.
Clear. Write short, simple, unambiguous instructional statements in the imperative mood by following the best practices described under Narrative text. Avoid jargon and define acronyms when they are first used.
Focused. Limit the tutorial’s content to only what is appropriate for the chosen tutorial type and what is necessary to meet the learning objective. Ideally, tutorials should not take more than 30 minutes to complete.
Consistent. Follow the formatting guidelines and use the templates for Jupyter Notebooks and Documentation-based tutorials.
Referenced. Provide the user with links to external resources (e.g., code package documentation, papers). Mention any precursor (or advanced) tutorials that users can consider as prerequisite (or as follow-up).
Credited. Individuals who contributed to the tutorial, or whose work was used as a basis or inspiration for the tutorial, must be acknowledged by name. Include paper citations where possible.
Tutorial types#
Every tutorial, whether a Jupyter Notebook or a documentation-based tutorial, must choose a single type from the three options below, be designed to fit into the tutorials’ organizational hierarchy, and follow the naming convention.
How-to: RSP functionality#
Short tutorials with a learning objective of how to use a single RSP function or tool.
These tutorials are typically written without scientific context or motivation - just simple examples for quick reference.
Each “How-to” tutorial should take up to about 10 minutes to work through.
Data product definitions#
Tutorials with a learning objective of understanding one of the data products for a given release.
These tutorials each focus on one data product, e.g., one image type, one map type, or one catalog table. They provide a description of the data and metadata, and demonstrate how to access the data product – via multiple methods (e.g., TAP and butler) where applicable.
Descriptions of the data and metadata can be mainly qualitative (i.e., primary columns, recommended flags) but should include key quantities such as counts, sizes, volumes, coverage, etc. These tutorials should link to the appropriate section of the data release documentation.
Science demonstrations#
Longer tutorials with a learning objective of executing an end-to-end scientific workflow.
These tutorials demonstrate data visualization techniques and scientific analyses that use multiple RSP tools and data products in sequence. They should describe key scientific concepts and include scientific context and motivation for why the data and tools are used.
Each “Science demonstration” tutorial should not take more than about 30 minutes to work through.
Organizational hierarchy#
Tutorials do not have defined learning levels or target audiences, but are arranged in a numbered, hierarchical system where they appear to the user in order from introductory-level to more advanced.
The “100 level” are the How-to: RSP functionality tutorials.
The “101 series” are how-to tutorials on a given RSP functionality, such as Jupyter Notebooks or the Portal UI.
The “101.1 tutorial” would be a very simple, introductory-level how-to tutorial on Jupyter Notebooks or the Portal UI.
Subsequent “101.x tutorials” would illustrate more advanced use of the functionality.
Subsequent “10x series” would be for other functionality, like TAP, butler, Firefly, and so on.
The “200 level” are the Data product definitions tutorials.
The “201 series” would be for a data product type, such as catalog tables.
The “201.1 tutorial” would be for the
Objectcatalog.Subsequent “201.x tutorials” would be for other tables,
Source,ForcedSource, and so on.Subsequent “20x series” would be for other data product types, like images and survey property maps.
The “300 level” are the Science demonstrations tutorials.
The “301 series” would be for a given astronomical field, such as cosmology or time-domain.
The “301.1 tutorial” would be an introductory-level demonstration within the astronomical field.
Subsequent “301.x tutorials” would be more advanced demonstrations of scientific analysis for the field.
Subsequent “30x series” would be for other astronomical fields.
Why a “learning level” is not part of a tutorial’s metadata: In the past (DP0-era), tutorials defined their learning level (target audience) as beginner, intermediate, or advanced. This was not useful for two main reasons. One, it is too challenging to be consistent in the application of qualitative user profiles (see RTN-002 [1]), and two, the learning levels were only in the header or in the readme file and not easily seen by users. For these reasons, the tutorials no longer have defined learning levels or target audiences, and the ordering system described above has been adopted instead.
Title conventions#
Tutorial titles (filenames or primary headers) are the main way that users navigate the tutorial set. While there will be a readme file with descriptions, it’s best to assume no one will read it.
Thus, tutorials should have descriptive titles (names) that are as short as possible. Yes, this seems like an oxymoron, and long titles might be necessary at times. A longer descriptive title is preferable to a shorter ambiguous title.
The titles of tutorials in the 100 level should not actually start with “How to”, but should be an action or the name of the service. Tutorials in the 200 level should be named simply by their data product. Tutorials in the 300 level should be in sub-folders by astronomical field, so that the titles can focus on the analysis being demonstrated without repeating the field.
Reference#
All tutorials should provide the DOI reference for Rubin tutorials, 10.11578/rubin/dc.20250909.20. Appropriate means to referencing this DOI are included in the Jupyter Notebooks tutorial template and in the Documentation-based tutorials template below.
Jupyter Notebooks#
Environment#
All tutorial notebooks must run with the RSP’s recommended image, with the LSST kernel (i.e., the default RSP environment). If a code package is not already installed, notebooks should not install it or rely on it. If this presents a blocker for tutorial development, discuss with the CST lead.
Template#
Use the template.ipynb file in the rtn-045 GitHub repository in the lsst GitHub Organization (template notebook tutorial).
Section structure#
Header#
In the first markdown cell, set the title using heading level 1 (use a single #).
Display the Rubin Observatory logo at upper left. To the right of the logo list the RSP deployment, the data release, the container size, the LSST Science Pipelines version, the date last verified to run, the repository, and the DOI.
In the second markdown cell, write five short statements in the same cell, each on a new line.
Learning objective: A very brief description of notebook’s learning objective.
LSST data products: List the catalogs and images used.
Packages: List the python packages that are relevant to the learning objective. For example, include
afwDisplayandlsst.daf.butlerfor a notebook about retrieving and displaying images, but standard supporting packages likeos,glob, ornumpyusually don’t need to be listed here.Credit: Start with statements such as “Originally developed by…” or “Based on notebooks developed by…” and then people’s names, including journal article or software release citations, as appropriate. Then add “Please consider acknowledging them if this notebook is used for the preparation of journal articles, software releases, or other notebooks.”
Get Support: Use the following verbatim: “Everyone is encouraged to ask questions or raise issues in the Support Category of the Rubin Community Forum. Rubin staff will respond to all questions posted there.”
Future work includes being able to auto-generate a table of tutorial contents from notebook metadata and markdown cells, so it is important to follow the template.
Introduction#
In the third markdown cell, name the first section “Introduction” using heading level 2: ## 1. Introduction.
Provide a brief narrative about this notebook’s learning objective, e.g., “This notebook demonstrates…”.
Cite or link to any external information or documentation.
Embed plots or images to help present key concepts.
Related tutorials: At the end of Introduction and before Section 1.1, if applicable, mention any other relevant tutorials by name. Do not link to them, because tutorials evolve continuously, there is no linkchecker for the notebook repo, and tutorial hotlinks go stale quickly. It is not necessary to mention the preceeding/subsequent tutorials in the same series as this one - those are trivial for the user to find. But do use the “related tutorials” paragraph to mention tutorials in other series, or of other types.
Import packages:
The first subsection of the Introduction should always be ### 1.1. Import packages.
It should have a markdown cell that provides explanations and/or links to external package documentation, as appropriate.
All package imports must be done in the first code cell.
Define parameters and functions:
The second subsection should be ### 1.2. Define parameters and functions, if needed.
Globally defined utility functions, classes, plotting defaults, or constants should be here.
Instantiations of the TAP or butler services should also be done here.
Single-use functions or classes should instead be defined immediately before they are used (it is more helpful for users to see code in context). See the guidelines for functions and classes in the Code cells section below.
It is ok to rename (or remove) this section if no functions or parameters (or neither) need to be defined.
It is also ok to have sub-subsections, such as #### 1.2.1. Define global cosmological parameter values
or #### 1.2.2. Define a function to make an image cutout, if there are many to be defined.
Additional sections#
Do not use title case for section headings; use sentence case. (This Is Title Case. This is sentence case.)
All sections must be numbered to enable referencing in support requests, so that users can say, e.g., “I’m having trouble with the second code cell in Section 2.3.”
Use descriptive section titles, e.g., “2.2. Create a color-magnitude diagram” instead of “2.2. Plot”, so that the auto-generated table of contents is more useful.
The contents of the additional sections should alternate between markdown cells with instructional statements written in the imperative mood (see the section on narrative text), and code cells to be executed by the user.
Exercises for the learner#
It is very common, but not mandatory, to end all notebook tutorials with a section called “Exercises for the learner”. This section should have specific tasks for users that will help them engage with the material. For example, a task might suggest changing a parameter and re-running some code.
Do not include untested exercises.
Do not word the exercises as questions, but rather as instructions or tasks.
It is best if at least the first exercise includes a hint for the user to know if they’ve done it correctly. For example, “try changing parameter X to be Y, then rerunning the notebook up to Section 3.2, and notice that Z is now 5”.
Use PEP8 and flake8#
PEP8 is the style guide for Python code that comprises the standard library of the distribution,
and flake8 is a tool to ensure compliance with these standards.
Use flake8-nb to ensure notebook code conforms to PEP 8 – Style Guide for Python Code, with a few exceptions.
Install flake8-nb with pip.
pip install --user flake8-nb
It is known that the most up-to-date version of flake8 has some issues.
If errors are encountered such as AttributeError: '_io.StringIO' object has no attribute 'buffer',
force-downgrade flake8 from version 4.0.1 to 3.9.2 with pip install flake8==3.9.2.
As flake8-nb no longer takes a configuration file of rule exceptions, either pass the configurations
as arguments every time flake8-nb is run, or set the following alias, e.g., in a .bashrc file.
alias flake8-nb='flake8-nb --max-line-length=99 --ignore=E133,E226,E228,E266,N802,N803,N806,N812,N813,N815,N816,W503'
Run flake8-nb on a notebook named <notebook.ipynb>.
flake8-nb <notebook.ipynb>
Run flake8-nb periodically during notebook development and fix errors.
Ensure flake8-nb runs clean before requesting a review.
Use jupyterlab-spellchecker#
The Jupyterlab-spellchecker has been installed for everyone on RSP.
When editing a markdown cell, Jupyterlab-spellchecker will highlight unknown words.
To avoid it highlighting unknown words in a code cell, use "{}".format(variable) or "%s"%variable instead of f"{variable}" in the code.
Markdown cells#
Every code cell should be preceded with a markdown cell that contains instructional statements written in the imperative mood (see the section on narrative text).
Use markdown format, and avoid html format.
Line breaks#
Avoid html format line breaks <br> in favor of \ at the end of the line.
Two spaces at the end of the line is also allowable in markdown, but a \ is a less ambiguous indicator of a desired line break.
Links#
Format links with markdown, like [link name](link address).
Do not use html links like <a href="link address">link name</a>.
Monospace font#
Markdown cell text should be in monospace font if:
it is the name of a package, function, class, or method
e.g.,
numpy,show_bokeh_inline,SkyCoord,Factory,to_table()
it is a variable used in a code cell
e.g.,
results
it is the name of a TAP table or Butler dataset, or a column name
e.g.,
Object,deep_coadd,source,diaObjectId
Indented text#
Use indented text only for warnings (see Known warnings) and figure captions.
Indented text is created as in the following examples, which can also be found in the template notebook.
> **Warning:** the following cell produces a warning which is ok to ignore because...
> **Figure 1:** Value 2 as a function of Value 1...
Embedded images#
Use the drag-and-drop method to embed images in markdown cells.
Double click on the markdown cell and put the cursor at the desired line. Drag-and-drop the image into the markdown cell, and a line of markdown code (similar to what is shown in the second line in the snippet below) will automatically appear. It is optional to add the first and third lines in order to define style settings like size.
<div style="max-width:300px">

</div>
Include a figure caption immediately after the embedded image, using Indented text. The figure should be numbered in the same series as generated plots, and the caption should include the citation to the source of the image.
Execute the markdown cell to see the image displayed. An example embedded image is provided in the template notebook.
Code cells#
All python code in Jupyter Notebooks should adhere to the Code Style Guidelines in the Rubin Developer’s Guide, and should Use PEP8 and flake8.
Functions, classes, and variables#
Functions, classes, and variables should be named following the Naming Conventions defined in the Rubin Developer’s Guide.
Functions should be lowercase, with words separated by underscores as necessary to improve readability (
snake_case).Classes should use the CapWords convention with leading uppercase (
CamelCase).Variables follow the rule for functions, and single-character variables should be avoided (use descriptive words).
Global functions, classes, and variables which are used more than once in a notebook should be defined in the introduction, but single-use functions, classes, and variables can be defined immediately before they are used.
Future work includes creating a package of commonly-used functions in order to avoid users encountering long blocks of code, and help keep notebooks readable.
TAP queries#
TAP queries should always be run as asynchronous as this is the best practice and a good habit for users.
Asynchronous TAP queries should be followed up with an assert statement to confirm the job completed. Including this assert statement will ensure notebooks that are run in full, either by users or mobu, stop and return an appropriate error related to the job phase.
rsp_tap = get_tap_service("tap")
job = rsp_tap.submit_job(query)
job.run()
job.wait(phases=['COMPLETED', 'ERROR'])
print('Job phase is', job.phase)
if job.phase == 'ERROR':
    job.raise_if_error()
assert job.phase == 'COMPLETED'
results = job.fetch_result()
As the execution of TAP queries can be time-variable, the notebook’s narrative text should not include
any estimates for how long the query should take, to avoid confusing or concerning the user.
The html files of executed versions of the notebooks (see Converted notebooks) will show the
execution time, should the user require an estimate.
Clearing memory#
To reduce the memory footprint of a notebook, remove figures once they’re no longer needed. This is only necessary in notebooks that demonstrate data visualization with large datasets.
def remove_figure(fig):
    """
    Remove a figure to reduce memory footprint.

    Parameters
    ----------
    fig: matplotlib.figure.Figure
        Figure to be removed.
      Returns

    -------
    None
    """
    for ax in fig.get_axes():
        for im in ax.get_images():
            im.remove()
    fig.clf()
    plt.close(fig)
    gc.collect()
Better ways to clear the memory are under consideration (see Future work).
Assert statements#
Where essential, or where a very specific value is expected, the assert command can be used to
demonstrate to users that a condition is true.
For example, assert statements can be used to confirm that service objects like TAP are not
None or null before moving on and using that instance,
or to check that values meet expectations (e.g., total rows returned from a query).
Do not use assert statements when, e.g., querying dynamic (prompt) datasets, which could return
different results and cause the assert statement to fail.
Consider more pedagogical alternatives when possible (e.g., printing schema columns would also fail if the TAP service was not instantiated).
Known warnings#
If a code cell produces a warning which is known and is safe to ignore, add an indented statement (see Markdown cells) about the warning _before_ the code cell which produces the warning.
Do not use, e.g., warnings.simplefilter("ignore", category=UserWarning), because
ignoring categories of warnings can allow real issues to go unnoticed.
Output#
Tables#
Always sort a table before displaying it. Sorting makes the table display exactly reproducible, which helps when performing the non-interactive “differencing” to compare notebook output with old and new versions of the environment (i.e., when preparing to “bump” the recommended image). It also makes notebook outputs exactly reproducible for all users, which prevents any confusion.
Results from a Table Access Protocol (TAP) service search are best displayed as an
astropy table using .to_table(), or as a pandas dataframe using .to_table().to_pandas().
Do not use the .to_table().show_in_notebook() method.
This can cause issues in the RSP JupyterLab environment that cause the notebook to hang indefinitely.
Plots#
Size:
Plots should be large enough such that the details in the data are easily discerned,
but small enough to fit within a small browser window (e.g., a laptop screen).
Typically, a statement such as fig = plt.figure(figsize=(6, 4)) is sufficient (or (6, 6) for square plots).
Labels: Axes labels with units are mandatory. A legend must be included if multiple types of data are co-plotted. A descriptive title is encouraged but not mandatory.
Style:
In general, the default matplotlib style is sufficient and should be adopted for plot attributes
such as line thickness, tick labels, fontsize, and so on.
Colors:
The default matplotlib color palette is not sufficient, and the recommendations
under Accessibility considerations should be used to
create colorblind-friendly plots.
Error bars: Error bars should be included wherever possible, and especially in cases where analyses such as line fitting is being performed on the data in the plot, to help the user understand data quality.
Captions: A markdown cell underneath the figure should provide a figure number and a caption in indented text that explains the main attributes of the plot. This caption should also serve as alt-text (as described under Accessibility considerations) and be descriptive enough for the user to confirm the plot was generated as expected.
Image display#
The preferred modes of image display are, in order: Firefly, afwDisplay, and then matplotlib.
Image orientation:
When using a World Coordinate System (WCS), display East left, North up.
If only using pixels, (0,0) should be the lower-left, which is the default for awfDisplay.
When using other plotting packages, transformations might be needed in order to match the afwDisplay default.
See the LSST Science Pipelines documentation about Image Indexing.
For example, with matplotlib, use of extent is necessary for displaying a WCS overlay for
deepCoadds when using imshow.
For consistency, extent should be used for all image types as in the following example.
deepCoadd = butler.get('deepCoadd', dataId=dataId)
deepCoadd_bbox = butler.get('deepCoadd_calexp.bbox', dataId=dataId)
deepCoadd_wcs = butler.get('deepCoadd_calexp.wcs', dataId=dataId)
deepCoadd_WCSfMd = WCS(deepCoadd_wcs.getFitsMetadata())
deepCoadd_extent = (deepCoadd_bbox.beginX, deepCoadd_bbox.endX, deepCoadd_bbox.beginY, deepCoadd_bbox.endY)
plt.subplot(projection=deepCoadd_WCSfMd)
plt.imshow(deepCoadd.image.array, cmap='gray', vmin=0, vmax=2, extent=deepCoadd_extent, origin='lower')
Input data files#
If a Jupyter Notebook tutorial requires a file of data, use the git large file storage (LFS)
associated with the tutorial notebooks repository.
Do not add data files to the tutorial notebooks repository.
Output data files#
If a Jupyter Notebook tutorial needs to write output files, instructions for where to save them depend on the use case.
In cases where the files are only to be accessed programmatically, they should be saved to the “deleted_sundays” scratch folder.
This folder can be accessed via the environment variable $SCRATCH_DIR.
Files that the user will be asked to open from the file browser should instead be saved to the user’s home directory so that it will be visible to them.
Documentation-based tutorials#
Tutorials for the Portal and API Aspects, or tutorials written as scripts that can be copy-pasted into the command line interface in the Notebook Aspect, are written in reStructuredText (RST) format and are kept within the data release documentation.
Template#
Use the template.rst file in the rtn-045 GitHub repository in the lsst GitHub Organization (template tutorial).
Section structure#
Header#
The RST file should start with a header, as in the example below.
For the Portal Aspect of the Rubin Science Platform at data.lsst.cloud.

**Data Release:** _DPX_ or _DRX_

**Last verified to run:** _yyyy-mm-dd_

**Learning objective:** _Very brief description of tutorial's learning objective._

**LSST data products:** _List the catalogs and images used._

**Credit:** _E.g., "Originally developed by" or "Based on tutorials developed by" and then people's names, including journal article or software release citations if appropriate._ Please consider acknowledging them if this tutorial is used for the preparation of journal articles, software releases, or other tutorials.

**DOI:** `10.11578/rubin/dc.20250909.20 <https://doi.org/10.11578/rubin/dc.20250909.20>`_

**Get Support:** Everyone is encouraged to ask questions or raise issues in the `Support Category <https://community.lsst.org/c/support/6>`_ of the Rubin Community Forum. Rubin staff will respond to all questions posted there.
Introduction#
Provide a brief narrative about this tutorials’s learning objective, e.g., “This tutorial demonstrates…”. Cite or link to any external information or documentation. Include plots or images to help present key concepts.
Include a paragraph on related tutorials, as in the introduction for Jupyter Notebooks.
Additional sections#
The rest of the tutorial should be divided into sequentially numbered steps, 1, 2, 3, etc.
If the tutorial is long, numbered sections can be included and then the step numbering can be 1.1., 1.2, … 2.1, 2.2, etc.
Steps should be short, one to a few sentences, and provide a single instruction or action item for the user. All Narrative text should be written in the imperative mood.
In some cases, the action might not be interactive with the RSP, and that is OK. For example, after a query is executed, the next step might be simply for the user to confirm that X rows were retrieved, and compare their results view to a screenshot.
Exercises for the learner#
It is very common, but not mandatory, to end all tutorials with a section called “Exercises for the learner”.
See the guidance for exercises in notebooks.
Code blocks#
Ensure that all code and any Astronomical Data Query Language (ADQL) statements are put into code boxes in RST so that users may copy-paste whenever possible. In RST, this is done as in the following example.
.. code-block:: SQL

  SELECT e, q, incl
  FROM dp03_catalogs_10yr.MPCORB
  WHERE ssObjectId > 9000000000000000000
Screenshots#
Use screenshots to demonstrate the steps of the tutorial, to show the user what to do, and to show the expected results for comparison. Augment screenshots with indicators (e.g., arrows or circles) to guide the users attention as needed.
All figures should be stored in the _static folder of the documentation repository.
Filenames for figures should follow the convention of using the base of the RST filename
(e.g., “portal-howto-01”) and adding the figure number (e.g., “portal-howto-01-fig1.png”).
Data visualizations should use the guidance for Colorblind-friendly plots.
Caption and alt-text: All figures should be numbered, and have both a caption and an Alternative-text (alt-text) statement. The motivation and guidance for writing alt-text is provided under Accessibility considerations.
To add a caption and alt-text to an image in RST, use the :alt: command
as in the following example.
.. figure:: /_static/figure_filename.png
  :name: name_of_figure
  :alt: Descriptive text of image (use tab to indent second line of text)

  Figure 1: The caption goes here, indented the same way, but with an empty line between code and caption text.
Input data files#
If a tutorial requires a data file (e.g., an example table for upload),
it should be stored in the _static folder of the same documentation
repository as the tutorial.
Accessibility considerations#
The following set of best practices should be adhered to for all tutorials.
Vision-impaired astronomers#
Colorblind-friendly plots#
To improve accessibility of Rubin plots and visualizations, the following recommendations should be followed:
Color alone should not be relied upon to distinguish between data series. Symbol shapes and line styles should be combined with color to provide redundancy, although it is recognized that this may not always be practical.
Validated palettes should be used. The recommended palettes have been tested with Color Vision Deficiency (CVD) simulators, perceptual color difference calculations, and direct feedback from individuals with CVD. It is not expected that every figure be processed through a simulator if these palettes are used and the guidelines in this section are followed.
Red and green should not be used together, since the most common form of CVD is difficulty differentiating red and green. This requirement is particularly important for the black-background palette below. For the white-background palette, tests have shown that the red–green contrast is acceptable.
Color combinations with high contrast should be employed so that they remain perceptually distinct.
In Jupyter Notebooks, in order to be accessible to those with Color Vision Deficiency (CVD or colorblind),
the color tables used for plots with matplotlib should be either a greyscale,
a preceptually uniform sequential colormap
like viridis or cividis, or
seaborn-v0_8-colorblind.
The seaborn-v0_8-colorblind color table can be loaded with the following python code.
import matplotlib.pyplot as plt
plt.style.use('seaborn-v0_8-colorblind')
For the LSST filter set ugrizy, use the dictionaries provided below, and always use symbols and line styles to represent the filters in addition to color.
Use these colors on a white background:
plot_filter_colors_white_background = {'u': '#1600ea', 'g': '#31de1f', 'r': '#b52626', 'i': '#370201', 'z': '#ba52ff', 'y': '#61a2b3'}
Use these colors on a black background:
plot_filter_colors_black_background = {'u': '#3eb7ff', 'g': '#30c39f', 'r': '#ff7e00', 'i': '#2af5ff', 'z': '#a7f9c1', 'y': '#fdc900'}
Use the following symbols:
plot_symbols = {'u': 'o', 'g': '^', 'r': 'v', 'i': 's', 'z': '*', 'y': 'p'}
Use the following line styles:
plot_linestyles = {'u': '--', 'g': (0, (3, 1, 1, 1)), 'r': '-.', 'i': '-', 'z': (0, (3, 1, 1, 1, 1, 1)), 'y': ':'}
The code that generates the example images below is available in: plot-colors-example.py. The symbols, linestyles, and colors recommended above can be retrieved by using the lsst.utils.plotting package:
from lsst.utils.plotting import (get_multiband_plot_colors,
                                 get_multiband_plot_symbols,
                                 get_multiband_plot_linestyles)
colors_white = get_multiband_plot_colors()
colors_black = get_multiband_plot_colors(dark_background=True)
symbols = get_multiband_plot_symbols()
line_styles = get_multiband_plot_linestyles()
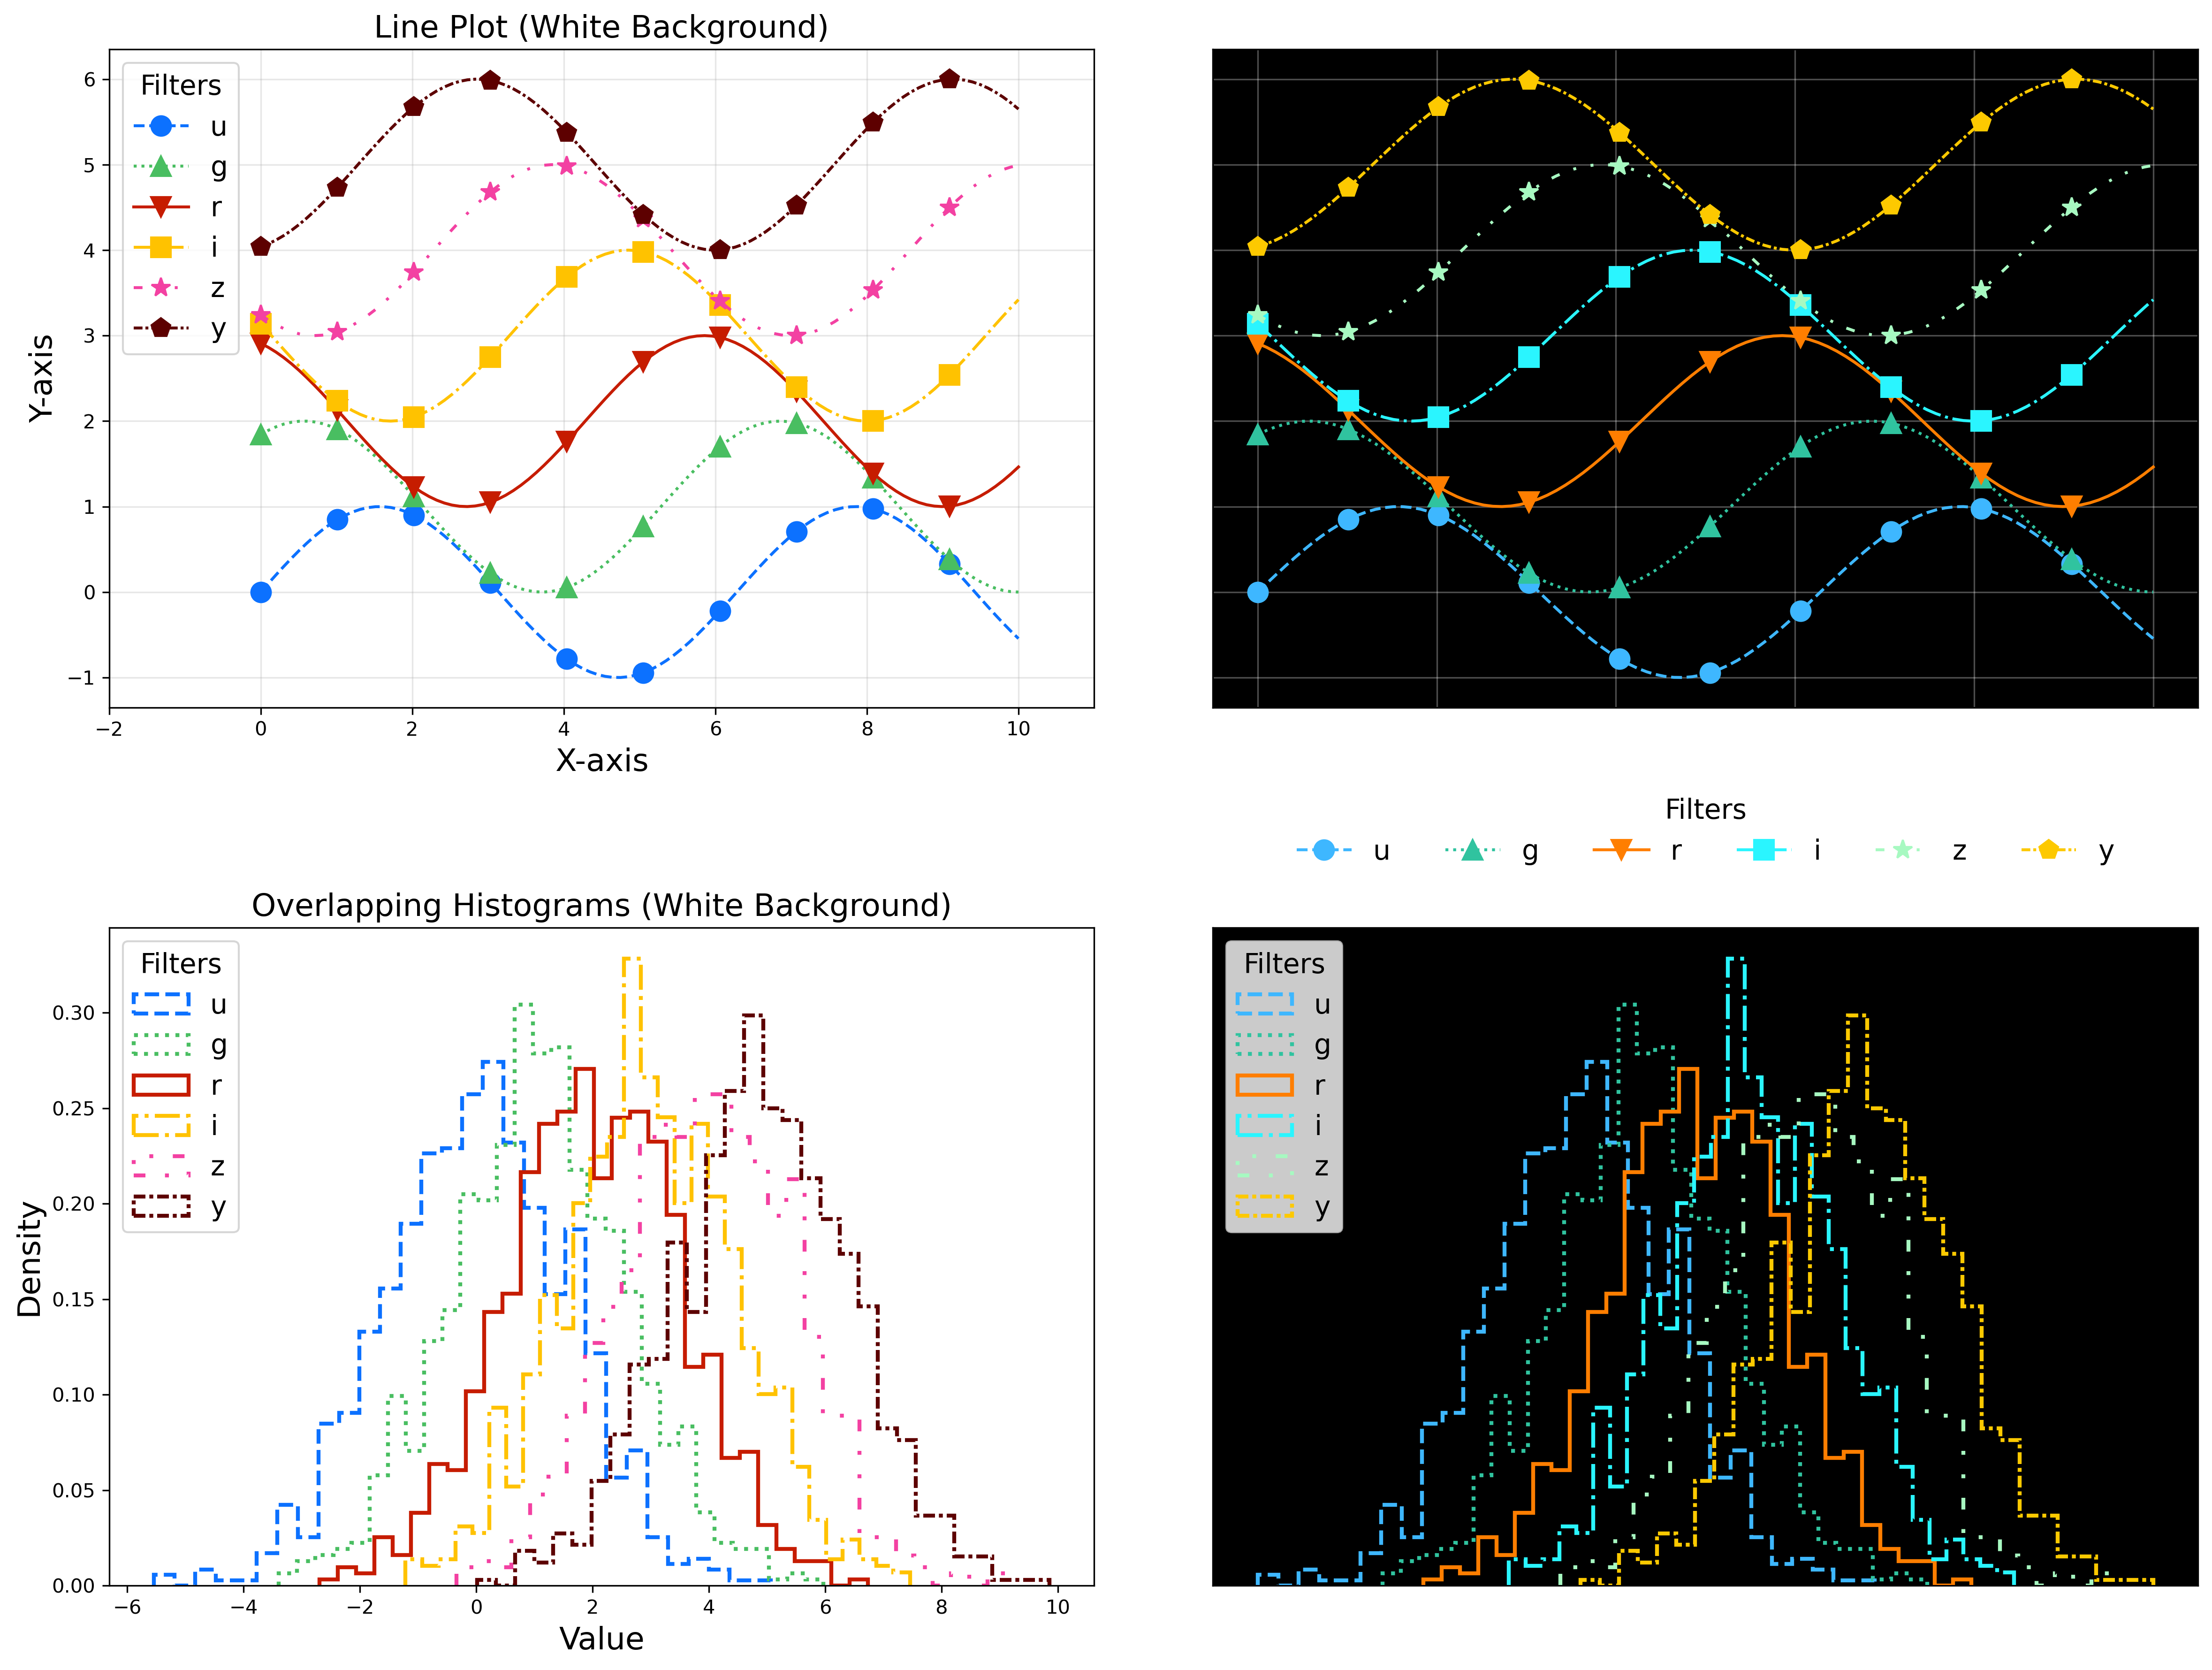
Fig. 1 Example plots demonstrating the symbols, linestyles, and colors to use to represent the six LSST filters on white and black backgrounds.#
Alternative-text (alt-text)#
Alt-text is added to figures, images, and graphics in the documentation and documentation-based tutorials (but not notebooks, where figures are typically dynamically generated) to ensure that visually impaired individuals, who use screen readers, are given sufficient information to understand what is displayed.
In general, alt-text descriptions can be written as either a literal description of the figure or image, or a more creative description. In CST tutorials, most figures display screen shots of the RSP portal interface and should describe the information in a practical way versus a creative way.
Guidelines for writing alt-text:
Be brief. Write in short, succinct sentences.
Write for the text to be read aloud.
Do not include written visual cues (e.g., quotation marks, dashes).
Spell out acronyms (e.g., use “Right Ascension”, not “RA”).
Avoid jargon and undefined terms.
Symbols and equations should be expressed in words (e.g., use “equals”, not “=”).
Pictures should be described in terms of what the listener needs to know (e.g., a large galaxy in the center).
For RSP screenshots, state which interface is being shown and describe the actions the user should take and the expected results, or the main functionality of the interface (as appropriate).
Use consistent terms such as the JupyterLab User Interface Naming Conventions.
Limit the use of visual cues, such as colors or shapes, or visual-centric language (e.g., do not say, “as you can see”).
If color distinguishes physical attributes, then describe the attribute rather than the color (e.g. a blue star versus a red star could be described as a hotter star and a cooler star).
For plots, include type of plot (e.g., bar, scatter), titles and labels, and a general explanation of the data and what it means.
Converted notebooks#
For offline viewing, create html versions of executed notebooks and not pdf versions, as
the latter are typically less compatible with screen readers.
At this time it is not necessary to use, e.g., nbconvert, but a customized application might be considered in the future (see Future work).
Neurodivergent astronomers#
Use fonts that work well for people with dyslexia, such as sans serif, monospaced, and roman font types such as Helvetica, Courier, Arial, Verdana and CMU (Computer Modern Unicode), OpenDyslexic.
Italic fonts decrease readability and should be used sparingly.
Avoid text crowding and long paragraphs. Use short sentences and, where possible, arrange text in shorter paragraphs.
Resources#
A few useful resources for accessibility include:
The document on Improving Accessibility of Astronomical Publications by the AAS Working Group on Accessibility and and Disability.
The Notebooks for All initiative by STScI.
Narrative text#
Introductory text should be written in present, impersonal tense, similar to the introduction of a journal article. Paragraphs may be used, but should be kept short. Content should be limited to only background information that is relevant to the tutorial.
Instructional text should be written in the imperative mood, as is commonly adopted for technical writing. Sentences should be kept short and unambiguous, only describing the actions the user needs to take to achieve the expected results. When the user action is executing code, the instructional text should describe what the code does in simple terms.
To implement the imperative mood in tutorials, use the infinitive or second-person present tense (often this is the same). Omit the “you” whenever possible, but it is OK to include “you” or “your”, especially when it clarifies the instruction. The passive voice should be avoided, as should use of “we”, “our”, and “let’s” or “let us”.
Below are a few examples to help with writing instructional statements in narrative text.
Best:
Run the query.
Also ok:
Run your query.
Do not use:
The query is run.
Now let’s run the query.
Here we run our query.
Rubin’s User documentation style guide contains additional writing resources.
How to contribute#
Contact any co-author of this document if you are interested in contributing to the set of tutorials.
Future work#
Work is on-going in these areas, and in time they will become part of the guidelines above.
Notebook metadata:
Embed notebook metadata (the header contents) in a way that can be scraped and used to auto-generate the README.md file or a Table of Contents for all notebooks, to enable users to browse notebook contents.
Accessibility: Continue to improve tutorials’ accessibility to people with disabilities by finding and implementing, e.g., screen reader compatibility software, data sonification packages, customized use of nbconvert, additional policies for supporting neurodivergent users, and other jupyter notebook accessibility techniques.
Translations: Translate at least the first-in-series (introductory-level) tutorials into Spanish. Additionally, improve tutorials’ accessibility to non-English speakers by finding and implementing automatic translation software.
Clearing memory:
Develop a best practice for how to keep notebook memory usage in check, in addition to deleting figures.
E.g., whether or not the del command is sufficient for this.
Package of commonly-used functions:
Create recipes for common user activities.
These could be, e.g., ADQL searches for the portal, code snippets for the command line,
or python modules that can be imported.
When these are used in the advanced notebooks, also demonstrate use of the inspect.getsource
functionality for users to display function code.
References#
Melissa Graham, Andrés A. Plazas Malagón, Jeff Carlin, Leanne Guy, Christina Adair, and Greg Madejski. Community Science Use Cases. Technical Note RTN-002, NSF-DOE Vera C. Rubin Observatory, May 2025. URL: https://rtn-002.lsst.io/.
Comments#
Do not use comments (
#) within a code cell as explanatory documentation.Every code cell should be preceded by a markdown cell that provides instruction and describes what the code does. Code cells should be kept short enough that intra-cell comments are not necessary.
Only use comments within code cells to comment-out optional code.